






Certified Microsoft Dynamics 365 Partner - Est. 1993 - Melbourne - Sydney

Microsoft Power Platform

Get Power BIConsulting Services in ANZ

Late reporting and inconsistent numbers from each team stall decisions. Count on DHRP as a trusted Power BI implementation partner across ANZ to connect all your Dynamics 365, finance and operational data into one governed view that provides leaders with accurate, up-to-date answers when they need them.

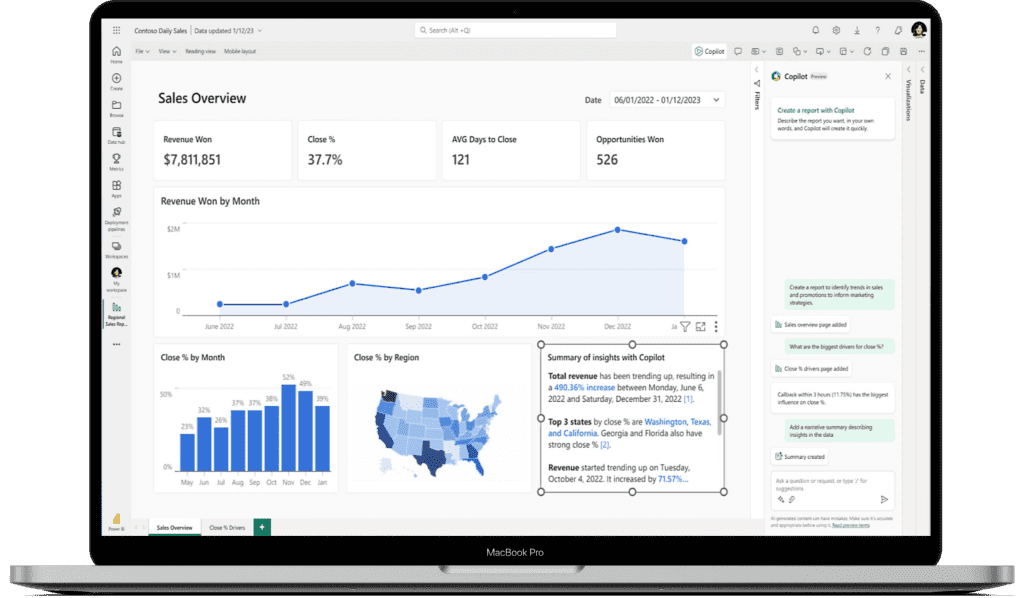
Microsoft Power BI dashboard on laptop

Trusted By Government, Non-Profit & ASX-Listed Companies

Wilson Security
Microsoft
Pepperstone
Wilson Security
Pacific HVAC
IPH
NPS MedicineWise
Pacific Ventilation
Wilson Security
Microsoft
Pepperstone
Wilson Security
Pacific HVAC
IPH
NPS MedicineWise
Pacific Ventilation

Microsoft Power BI

What Is Microsoft Power BI?

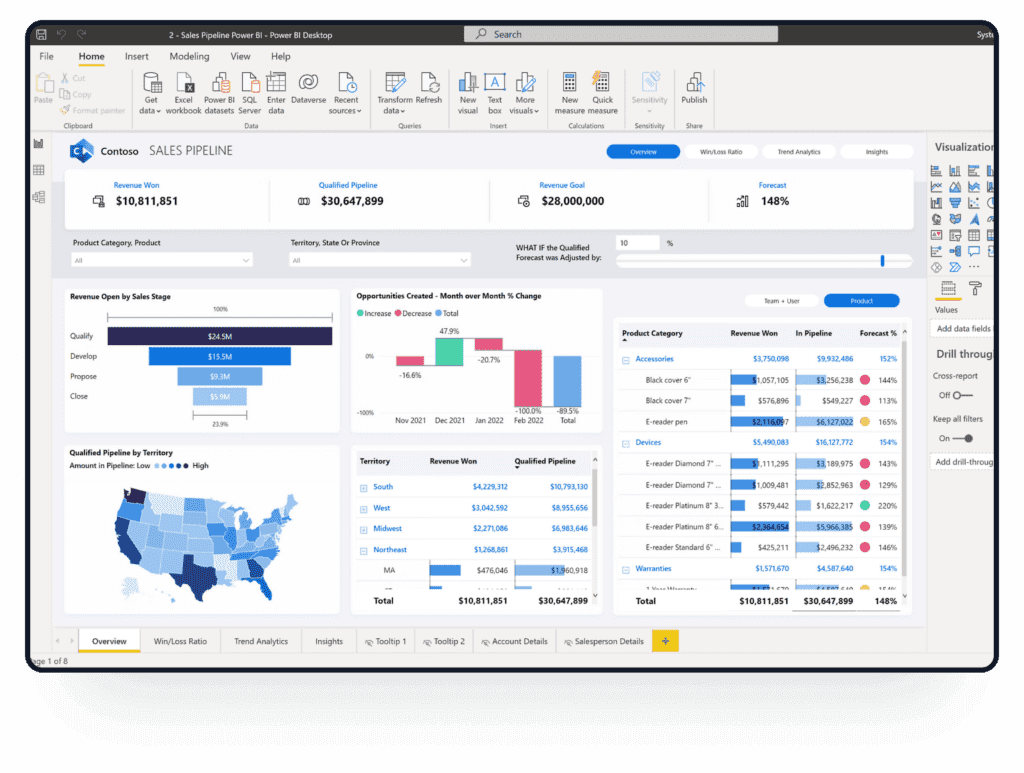
Microsoft Power BI reporting dashboard

It is the Microsoft technology-driven business intelligence product. It analyses and visualizes raw data to provide usable knowledge, including Microsoft Fabric or traditional warehousing. Also, it combines business analytics, data visualization, and best practices to use data to support an organization's decision-making.

You can share and visualize your data. In order to create dynamic dashboards and Business Intelligence reports, it transforms data from many sources.

Why Power BI

  • Reports and dashboards for SaaS products that are already established.

  • It enables dashboard changes in real-time.

  • Offers a Secure and trustworthy connection to your on-premises or cloud-based data sources

  • It provides a secure environment, hybrid configuration, and quick implementation.

  • It provides a dashboard visualization option that is continuously updated with the community.

Power BI Features

Data Modelling and DAX

Power BI's data modelling engine, which is based on the Power Pivot technology, enables you to build tables, define relationships and add calculations. Every report is based on the same business logic with data analysis expressions (DAX) and can provide numbers that your teams can rely on.

Semantic Models

The data that Power BI reports use is loaded in semantic models (also known as datasets). Retrieve data from a variety of sources, including cloud and on-premises data, and then use a single governed model in multiple reports. Colleagues can work on trusted data, not from scratch, as connected models are displayed in the workspace.

Power BI Desktop

Create reports in the free authoring tool, Power BI Desktop. Join to your data, shape it and create visuals without advanced report design or query capabilities. Once a report is complete, share it with the Power BI service so that others can view, explore and share it.

Power BI Reports

A Power BI report is one or more pages of visuals, from line charts to pie charts, maps to treemaps. Create reports from the ground up, linking to Excel, databases, SaaS apps and more, or share reports with colleagues for them to import and then explore across and highlight for the story.

Copilot AI Insights

With simple, natural language questions about your data, or by describing the report you want, Copilot in Microsoft Fabric handles all the work. Creates visualisations, summaries and narratives that explain trends and patterns, such as why sales were up this quarter, without the need to manually build reports to communicate insight.

Microsoft Fabric and OneLake

Power BI is the business intelligence layer of Microsoft Fabric, bringing together data ingestion, visualisation and more. OneLake is a single repository for your data that offers consistent security and governance, and one capacity model enables you to share reports with users who don't have paid licences and access other Fabric workloads.

Microsoft Power Platform

Power BI Consulting and Implementation Services in ANZ

DHRP is a certified Microsoft Dynamics 365 partner based in Melbourne and Sydney, supporting ANZ businesses in planning, building and running Power BI. Whether it's strategy, custom dashboards, integration with Dynamics 365 or training, our consultants provide reporting that is trusted, understood and used by teams every day.

Power BI Consulting Services

Our Power BI consulting services begin with the identification of your data sources, what you are looking to report on, and your business objectives. Then, we build your practical roadmap, including your architecture, your licensing plan, your security and governance - where your investment in Power BI will be focused around your people, your budget, and your leaders' decision-making.

Custom Dashboard Development

We build Power BI dashboards around the metrics that your leaders use. A consistent and tidy design, interactive visuals and drill-through pages provide every team with clear views of finance, sales, operations and workforce data, allowing them to detect issues early and make faster, more confident decisions across the entire business.

Power BI Implementation

We are your Power BI implementation partner in ANZ, linking your data sources, cleaning and modelling your data and establishing secure workspaces. Real-time accuracy, scheduled refresh, and tested semantics ensure that reports are accurate, controlled and ready to be used by your teams with confidence from day one.

Power BI Integration Services

Our specialised Sydney/Melbourne and other consultants offer Power BI integration services, connecting Dynamics 365, Microsoft Fabric, Azure and on-premises systems. Centralise finance, HR, supply chain and customer data, eliminating manual exports and duplicated effort when reporting across the business.

Power BI Reporting & Data Analytics

We are Power BI reporting and data analytics consultants who advise you on your current reports and data models and eliminate duplication and standardise your KPIs. We optimise slow models, migrate legacy Excel / SSRS reporting and guide teams through the transition from manual spreadsheets to automated self-service reporting that they can trust each and every day.

Power BI Training & Continuing Support

We teach your staff how to create, modify and publish reports with ease. Once your Power BI environment is live, our managed support will ensure that your Power BI environment continues to provide value as your business, your data and your reporting needs continue to expand.

Faqs

Most Frequently Asked Questions

Still have questions? Our team is happy to help.

Talk to Experts

Typically, Power BI consulting services in Australia include strategy and licensing guidance, integration with your data sources, data modelling, custom dashboard development, security setup, user training, and continual support. Whether you're looking for a single dashboard for a single team or an organisation-wide analytics platform that will scale with your business, DHRP customises each engagement to fit your objectives.

Seek a Microsoft partner that has local consultants and has experience in Dynamics 365 and Data integration, and has established governance practices. Request examples of similar projects and if it is not typical for the project, how they manage security, training and support after go-live. Since 1993, DHRP has been Australian-owned and operated, with teams in Melbourne and Sydney who understand and know the needs of ANZ business.

The price of a custom Power BI dashboard depends on the variety of data sources, data quality, model complexity, the number of dashboards, and security requirements. Microsoft licensing, including Power BI Pro, Premium Per User or Capacity for Power BI Fabric, is paid separately. After a complimentary consultation, you will know exactly how much DHRP will charge you before work can begin.

Yes, but we are not just limited to Sydney. We have both teams helping businesses in Australia and NZ with Power BI integration services. We integrate Power BI with Dynamics 365 Finance, Supply Chain, Sales & Human Resources, Microsoft Fabric, Azure, SQL Server and Excel and turn multiple data sources into a single controlled set of reports.

A Power BI reporting and data analytics consultant is the one that transforms data into trustworthy insights. They identify your KPIs, create the data model, design dashboards, configure security, automate data refresh and train your users. The outcome is reporting that matches business outcomes, which means teams are not relying on spreadsheets that they have to manually compile.

Get in Touch with us Today!

We'd love to hear from you. Please fill out this form.

Security Check2 + 4 = ?